
Reports and analytics
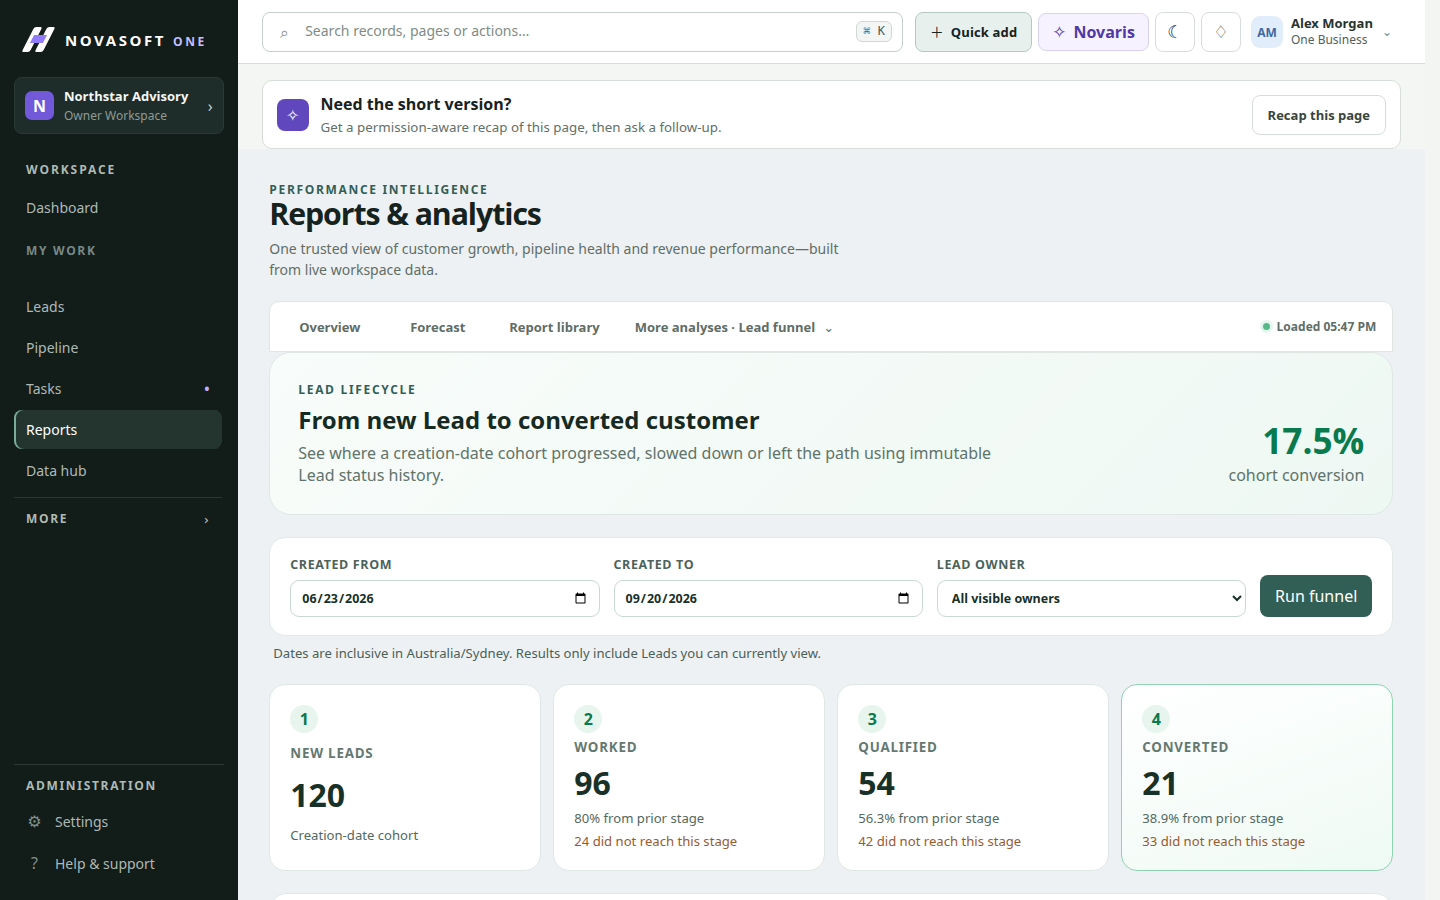
See how sales, service and delivery are performing, and click through to the records behind each number.
Reports that lead somewhere
Overview reports, funnel analysis and forecast measures across your customers, sales, service and projects. Every figure links back to the records that make it up.
- See how sales, service and delivery are tracking
- Find where leads drop out
- Click from a number to the records behind it
How it works
Open reports
Start with the overview for the whole business.
Go deeper
Use funnel and forecast views for sales.
Drill down
Click a figure to see the records that make it up.
Why did sales dip?
An owner sees fewer won deals this month, opens the funnel and finds fewer qualified leads came in. The records show a web form stopped sending enquiries.
Good to know
- Reports are on Professional plans and above.
- Each person sees only data they’re allowed to.
Questions about Reports and analytics
More answers on the questions page.
Is the dashboard included on lower plans?
Yes. The dashboard is on every plan; reports start on Professional.
Can we export reports?
Use the report builder and shared views to work with report data.
Guides on this topic
Practical advice for small businesses, whichever software you use.
Five reports every small business owner should check each week
The handful of numbers worth checking every week: new enquiries by source, response time, pipeline and forecast, won and lost, and support backlog.
Running the businessKeeping your CRM data clean: a monthly routine
Duplicates, gaps and stale records quietly make a CRM less useful. A simple monthly routine and a few rules that keep your customer data trustworthy.
CRM basicsHow to move your customer list from spreadsheets into a CRM
A step-by-step plan for importing contacts and companies into a CRM: cleaning the list, mapping columns, testing a sample and checking the result.
Works well with
Start with the customers you already have.
Free for up to two people, with no card needed. Upgrade when you need service, projects or automation.